What is the most confusing thing for small business owners? For many, it is these important (but confusing) reports from your accounting software: the Income Statement, the Balance Sheet & the Cash Flow Statement.
Brian Feroldi (@BrianFeroldi) has built the best (and possibly the simplest) visual guide I’ve seen. Let’s start small and work on getting a basic understating of each report.
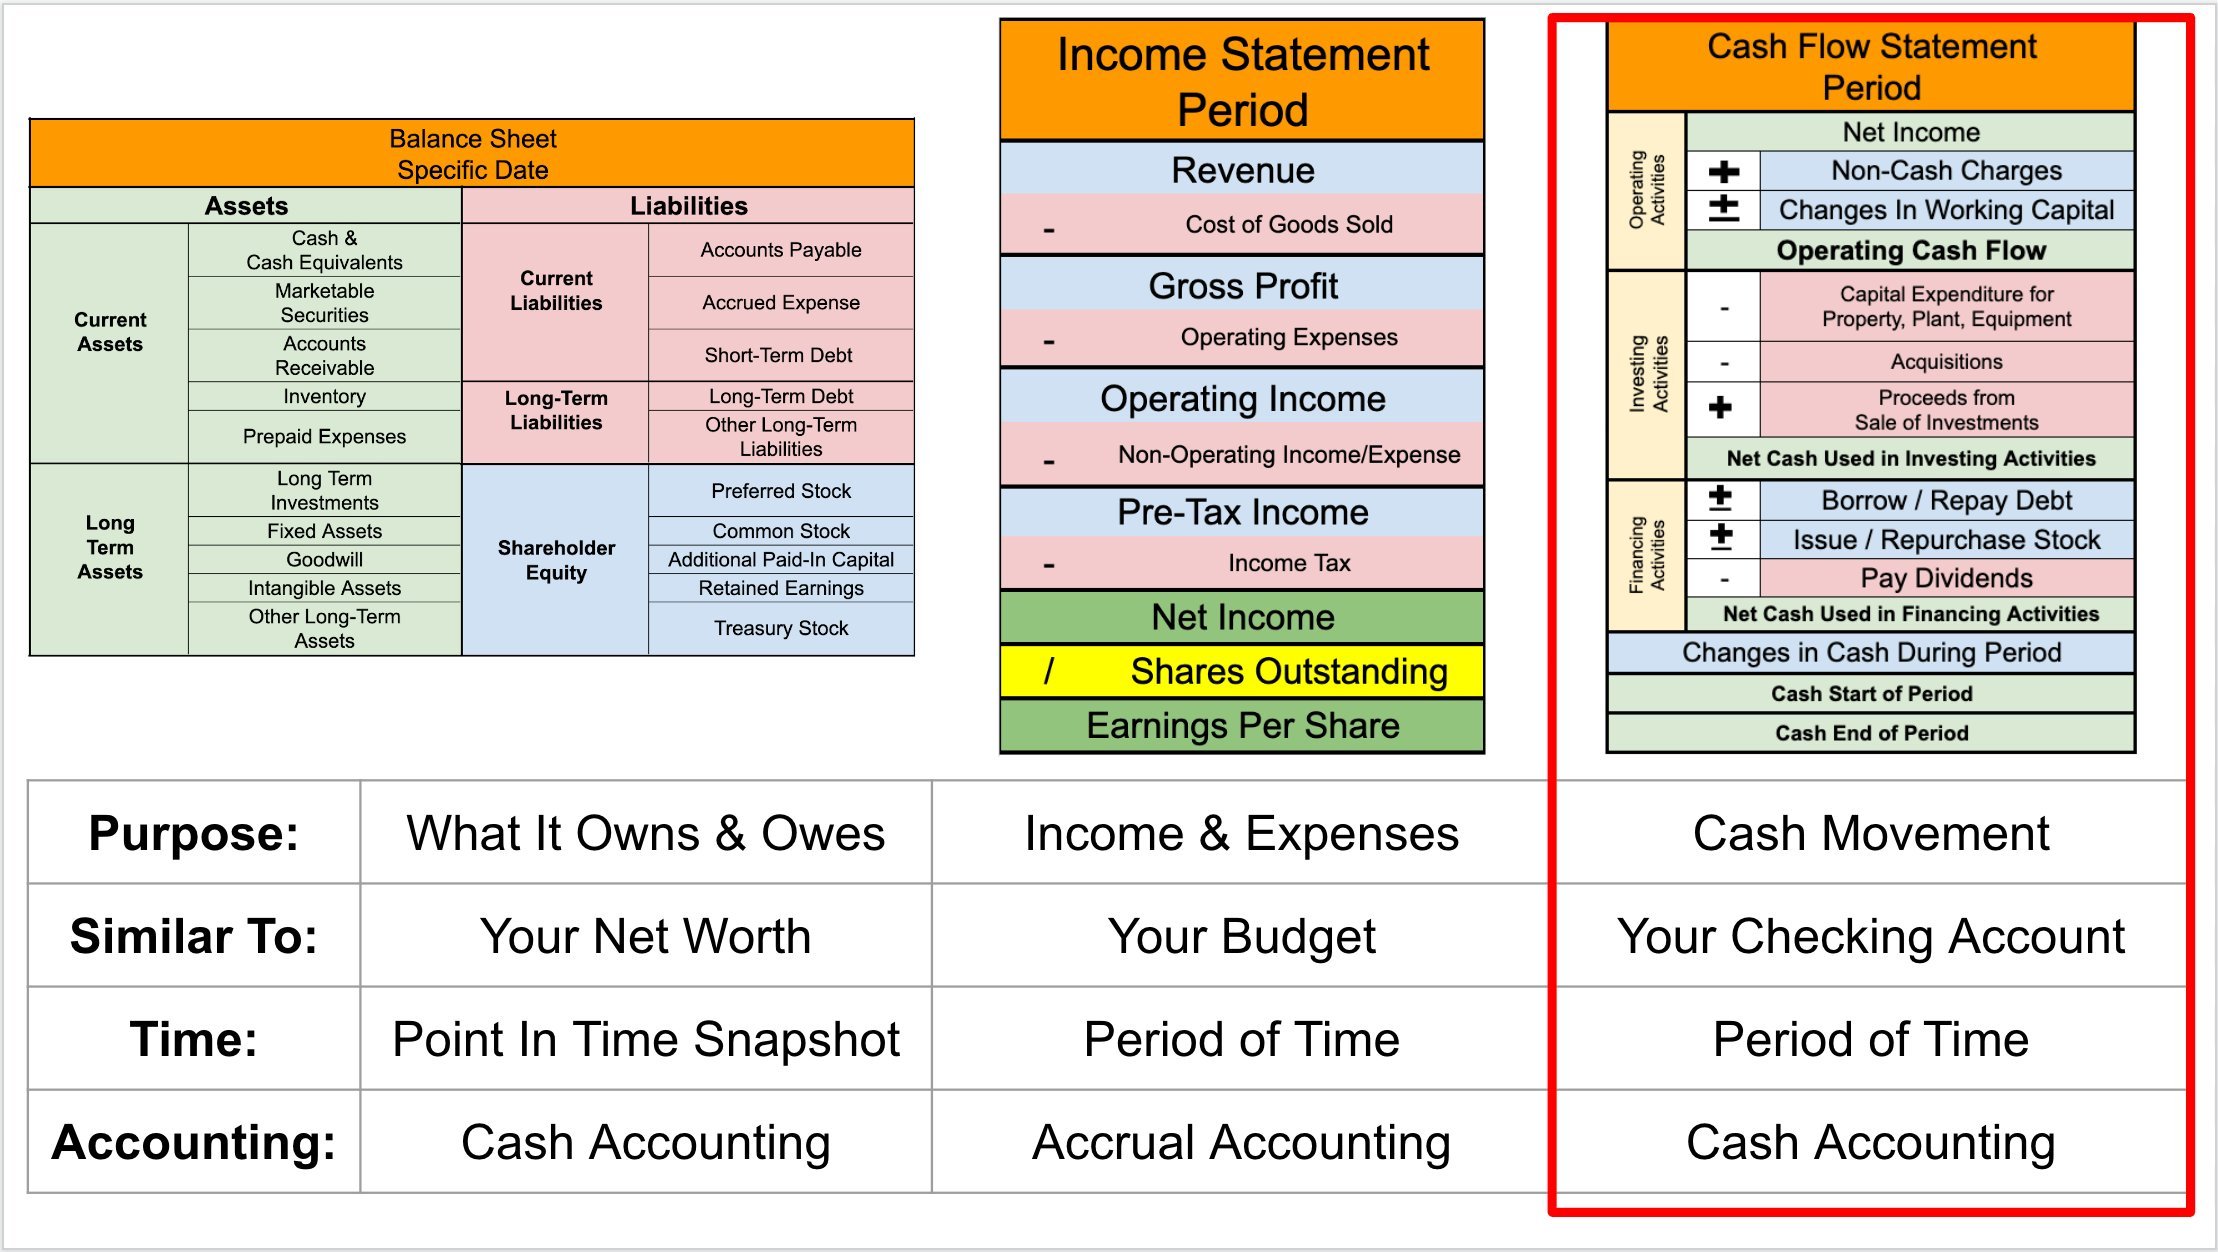
High-level summary of accounting statements from Brian Feroldi. The Cash Flow Statement is highlighted because it’s the most important (but unfortunately, not the most popular).
The most popular financial statement is the Income Statement (which is also called the Profit & Loss Statement). The Income Statement shows your business’s income and expenses over a period of time using accrual accounting.
The Balance Sheet is a summary of what your business owns (assets) and owes (liabilities) at a point in time. It uses cash accounting.
Lastly, the Cash Flow Statement shows the moment of cash over a period of time using cash accounting.
Business owners quickly figure out the difference between the Income Statement and Cash Flow Statement when their bank balances aren’t aligned with their “net income” figures. If I’m making all this profit why don’t I have any cash?
The Income Statement (also called the Profit and Loss Statement “P & L”)
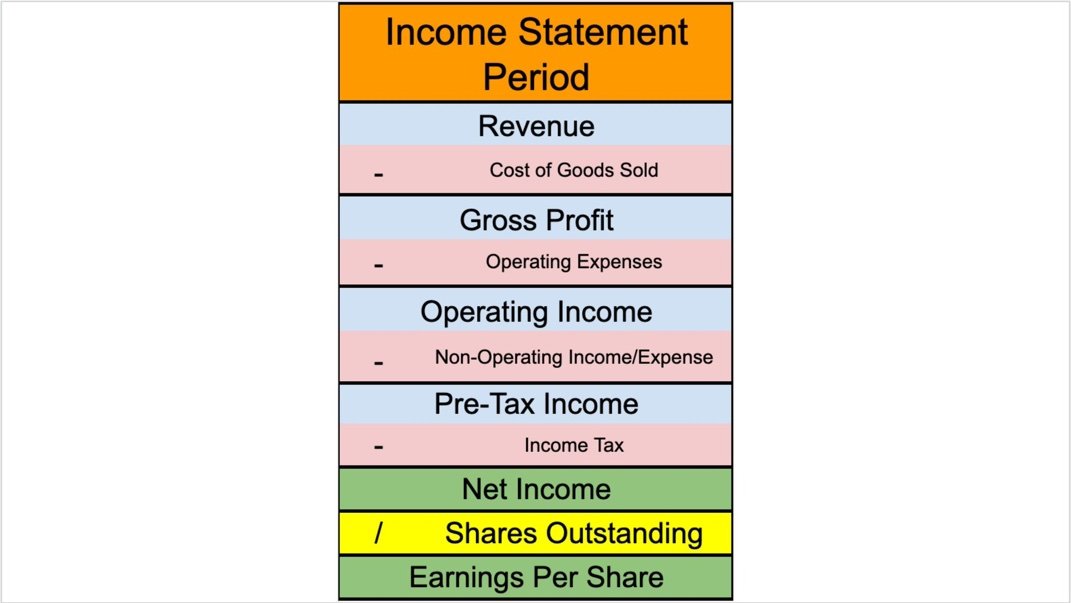
At its core, that Income Statement is trying to show how your company makes money (Net Income) and how your expenses are distributed. The simplest Income Statements will have the following structure (again, I’m using visuals from Brian Feroldi).
The top of this table will always be “Net Revenue” (Total Sales) during the period shown. When folks say “top line revenue” they truly mean the revenue from the top line of your Income Statement. As we move down the Income Statement we subtract expense by expense until we get to Net Income.
The first expense is the Cost of Good Sold (also called the Cost of Sales). The “Cost of goods sold (COGS) refers to the direct costs of producing the goods sold by a company.” As such manufacturing companies will usually have a much higher COGS than service companies.
Revenue - Cost of Goods Sold = Gross Profit
Gross Profit (also called Gross Income) is the total profit after accounting for the direct costs of selling the goods your business makes, but calling it profit seems misleading because there are still a bunch of very real expenses that your business has to cover.
Gross Profit - Operating Expenses = Operating Income
Operating Expenses are the total expenses required to operate your business (sometimes these are spilt out into categories including selling, general and administrative expenses, research and development expenses, depreciation and amortization, etc). When Operating Expenses are removed from Gross Profit, you have Operating Income (sometimes called EBIT = Earnings Before Interest and Taxes).
Operating Income - Non-Operating Income = Pre-Tax Income
Non-Operating Income is most commonly interest that you pay to someone else or interest that is paid to you (investment income is also recorded here). For most small businesses the difference between Operating Income and Pre-Tax Income is small. A good CFO can significantly enhance Non-Operating Income! Pre-Tax income is also called Earnings Before Tax.
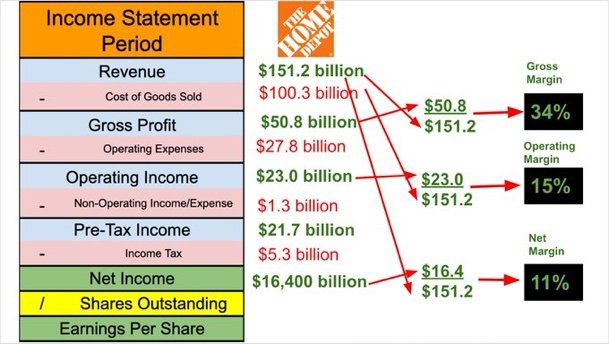
Normalizing your financial metrics helps benchmark your business against your peers. The most common
The Balance Sheet
Half the confusion about these financial statements seems to tie back to understanding the time periods shown. The Balance Sheet shows financials at a point in time (example: December 31, 2023). This defers from the Income Statement and Cash Flow Statements which show financials over a period of time (example: January 1, 2023 - December 31, 2023).
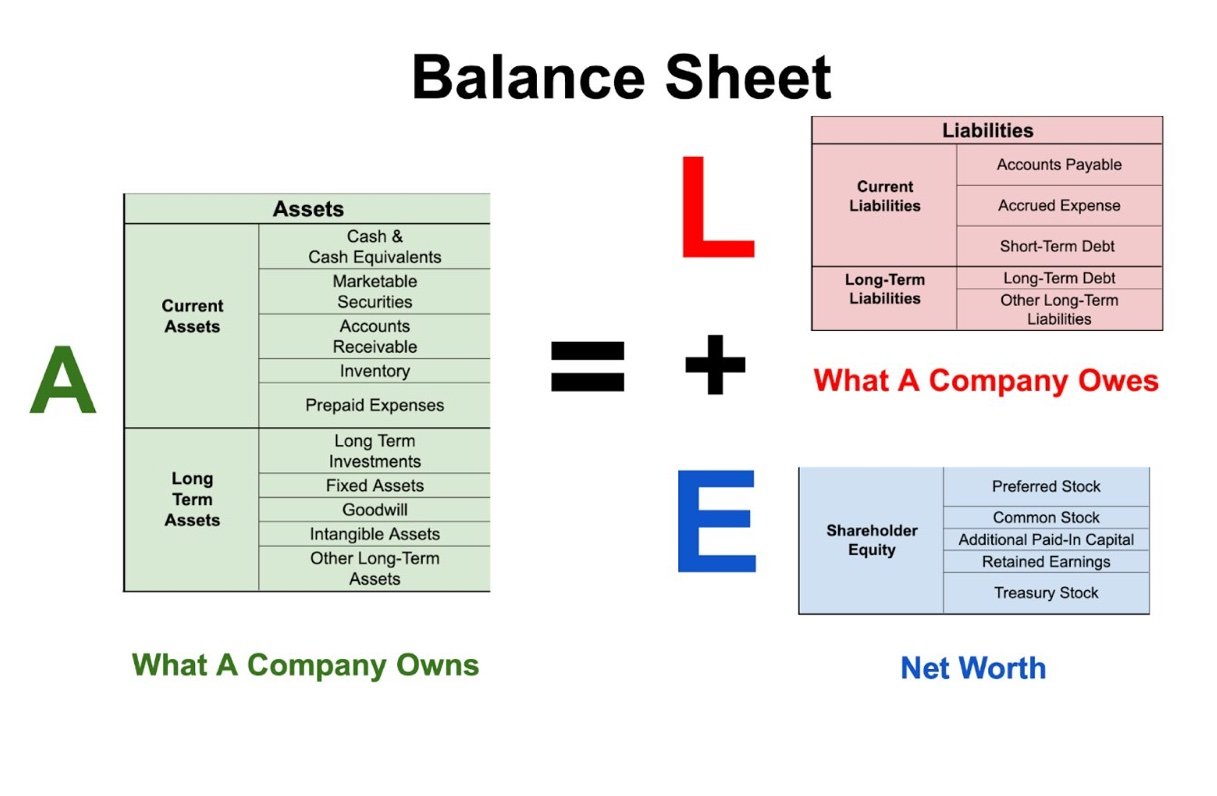
The balance sheet is built on one central equation: Assets = Liabilities + Shareholder Equity. For some people, it’s easier to think of the equation like this: Assets - Liabilities = Shareholder Equity… because if I have $100 but I owe a friend $10 my ‘net worth’ is $90 ($100-$10=$90). In “balance sheet speak” your net worth is your shareholder equity. This formula must be in balance at all times, so anytime your business has a change in assets or liabilities the balance sheet is impacted.
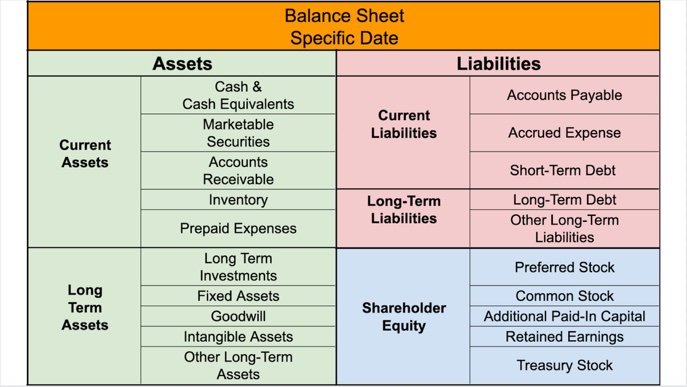
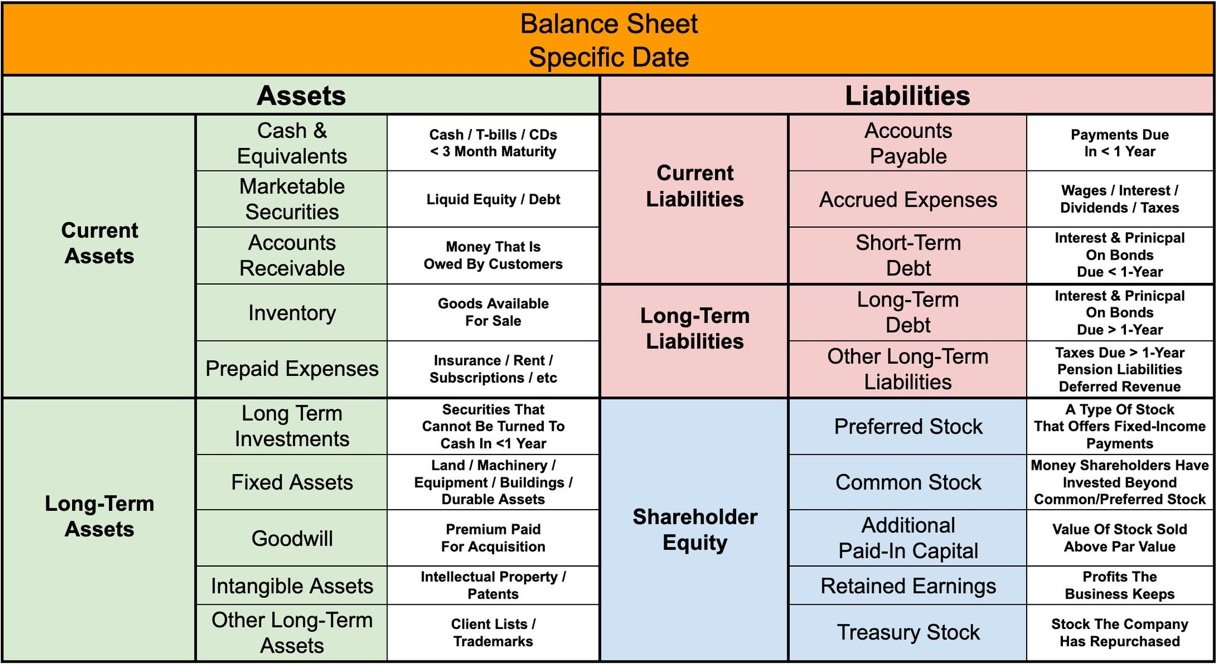
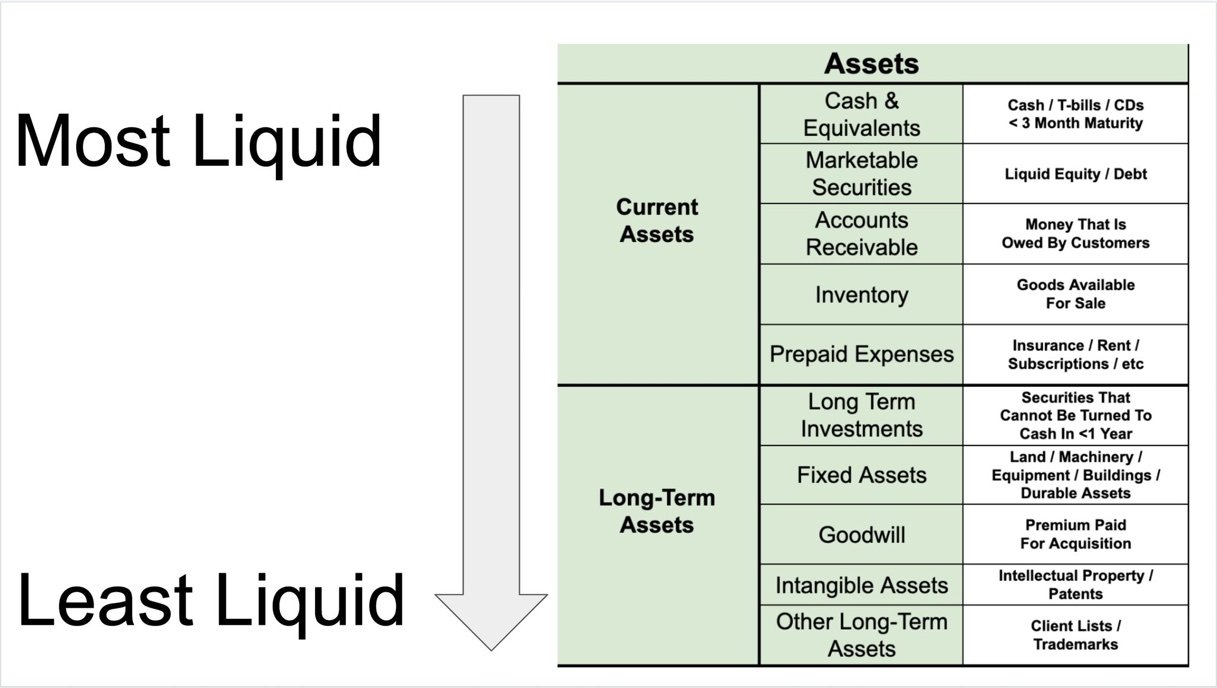
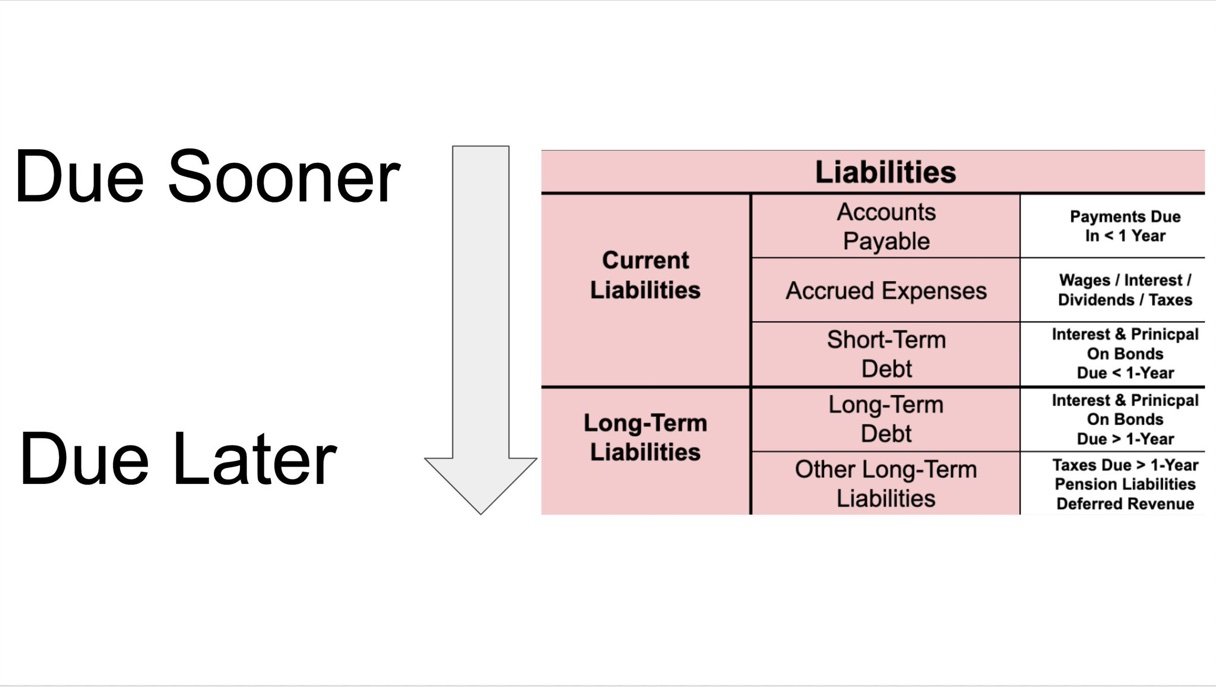
What type of assets and liabilities goes where? Brian’s graphics below will give you examples.
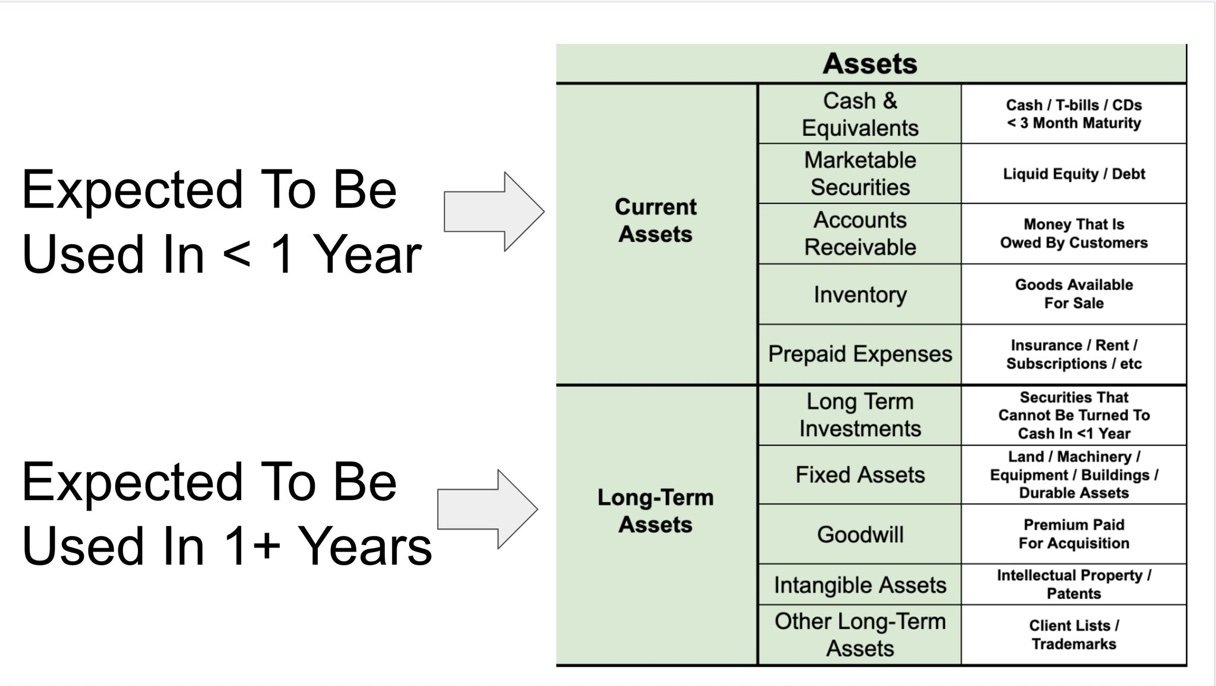
Current assets are assets that are expected to be used in the next 12 months.
Long-term assets are expected to be used for more than 12 months (Buildings, Equipment, Trademarks, Patents, etc.)
Liabilities use the same methodology. Current liabilities are due in less than 12 months and Long-term liabilities are due in more than 12 months.
One great “shortcut” to identify a company’s near-term financial position is the Current Ratio. The Current Ratio = Current Assets / Current Liabilities. A Current Ratio of less than 1 is a challenge… the company has more liabilities than current assets and will likely struggle to pay the bills. But a current ratio of 2 or more? That company has more than double the amount of short-term assets than is required to bill their bills. They are in good shape!
Lastly, Shareholders Equity. For many small to medium-sized businesses stock isn’t formally allocated (or at least not publicly traded) so the Shareholders Equity section is simpler than what is shown below. Think of this simply as the net worth of the company, which in the simplest sense is equal to the amount of retained earnings held by the business.
The Cash Flow Statement
Coming soon!

